Run a Simple Service with Observability on Kubernetes
Categories:

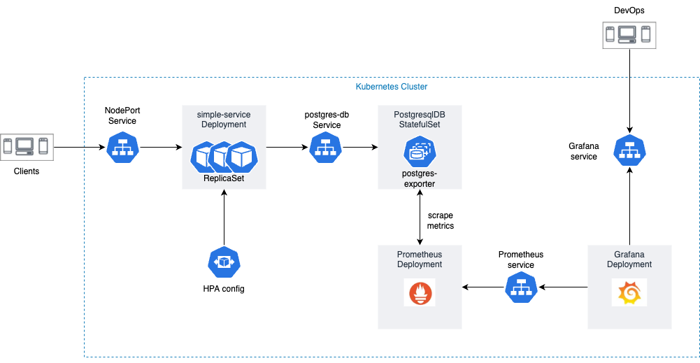
Application Infrastructure Diagram
Kubernetes has revolutionized the way we deploy and manage containerized applications, providing a scalable and resilient platform for running microservices. In this blog post, we will explore a comprehensive repository, k8s-simple-service, which showcases the deployment of a simple service, a PostgreSQL StatefulSet, and how to set up monitoring using Prometheus and Grafana. Let’s dive in and learn how to leverage Kubernetes to build and manage robust application infrastructure.
Deploying a Simple Service with High Availability
The first part of the repository focuses on deploying a simple service in Kubernetes with high availability. It provides a step-by-step guide and configuration files to create the following Kubernetes objects:
- Deployment: Defines the desired state for the simple service and manages the pods running the service.
- Service: Exposes the simple service within the Kubernetes cluster, allowing other services to access it.
- Ingress: Configures external access to the service by routing incoming traffic based on specified rules.
By following the instructions, you’ll be able to deploy a scalable and resilient service that can handle high traffic loads and automatically handle failovers.
PostgreSQL StatefulSet for Data Persistence
In the second part of the repository, you’ll explore how to deploy a PostgreSQL StatefulSet in Kubernetes to ensure data persistence and reliability. The repository includes YAML files that define the following Kubernetes objects:
- StatefulSet: Manages the deployment and scaling of the PostgreSQL database pods, ensuring stable network identities and persistent storage for each pod.
- Headless Service: Provides a network identity for the StatefulSet pods, allowing them to communicate with each other.
- Persistent Volume Claim: Requests and binds persistent storage for each PostgreSQL pod, ensuring data persistence across pod restarts or rescheduling.
By following the provided instructions, you’ll be able to deploy a PostgreSQL database that can dynamically scale and handle data replication across multiple pods.
Monitoring with Prometheus and Grafana
The final part of the repository focuses on setting up monitoring for the deployed services using Prometheus and Grafana. It includes configuration files and instructions on how to deploy the following Kubernetes objects:
- Prometheus Deployment: Deploys the Prometheus monitoring system, which collects and stores metrics from the Kubernetes cluster and the deployed services.
- Grafana Deployment: Deploys the Grafana visualization tool, which provides a user-friendly interface for querying and visualizing metrics stored in Prometheus.
- ServiceMonitor: Defines the monitoring targets and metrics to be scraped by Prometheus, enabling monitoring of the deployed services.
By following the steps outlined in the repository, you’ll be able to gain valuable insights into the performance and health of your applications through the Prometheus and Grafana monitoring setup.
Usage
- Start the
minikubecluster and installkubectlfor the cluster:
make infra
- Build and deploy the app:
make build deploy
- Run every single below commands in 3 different terminals to get services’ link:
minikube service simple-service --url=true
minikube service prometheus-service --url=true
minikube service grafana --url=true
Remember to add /live after simple-service URL.
- Configure Grafana
- Using
admin/admincredential to access Grafana - Import Postgres dashboard with the ID is
9628and the data-source ispromethues
- Clean the infrastruture:
make clean
Conclusion
The k8s-simple-service repository provides a comprehensive guide to deploying a simple service, a PostgreSQL StatefulSet, and implementing monitoring using Prometheus and Grafana in Kubernetes. By following the instructions and leveraging the provided configuration files, you can build and manage a robust and scalable application infrastructure on Kubernetes. Explore the repository, experiment with different configurations, and enhance your knowledge of Kubernetes deployment strategies and monitoring techniques.k8s